Buchanan, Michigan
The City of Buchanan, population 4,294[4], is a historic mill town tucked along a bend in the St. Joseph River in Berrien County, Michigan. The town is popularly known as “Redbud City”, a moniker earned due to the numerous mature redbud trees (Cercis canadensis) lining city streets. In 2019 Buchanan earned distinction from the National Arbor Day Foundation as a Tree City USA.
Land Cover Classification
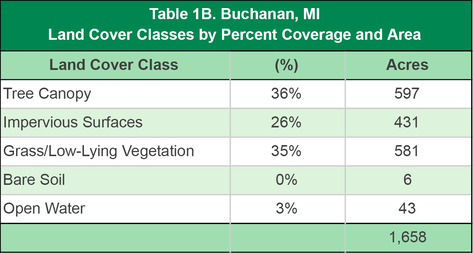
Buchanan’s tree canopy is estimated to cover 597 acres and accounts for 36% of the city’s total land cover (Table 1B). Approximately 35% of the city’s land cover consists of grass and/or low-lying vegetation, and impervious surfaces such as buildings, roads, and other types of pavement cover 26% of total land area.
Figure 1B presents a map of Buchanan with an overlay of the five classifications of land cover. The highest concentrations of tree canopy cover appear located in the northeast quadrant of the City, along the St. Joseph River, and in the southwest quadrant along McCoy’s Creek Trail West End. The highest concentrations of impervious surfaces are found in Buchanan’s city-center, surrounding the intersection of Front Street and Red Bud Trail, and industrial areas, which include the Jack-Post corporation and Fapco, Inc.
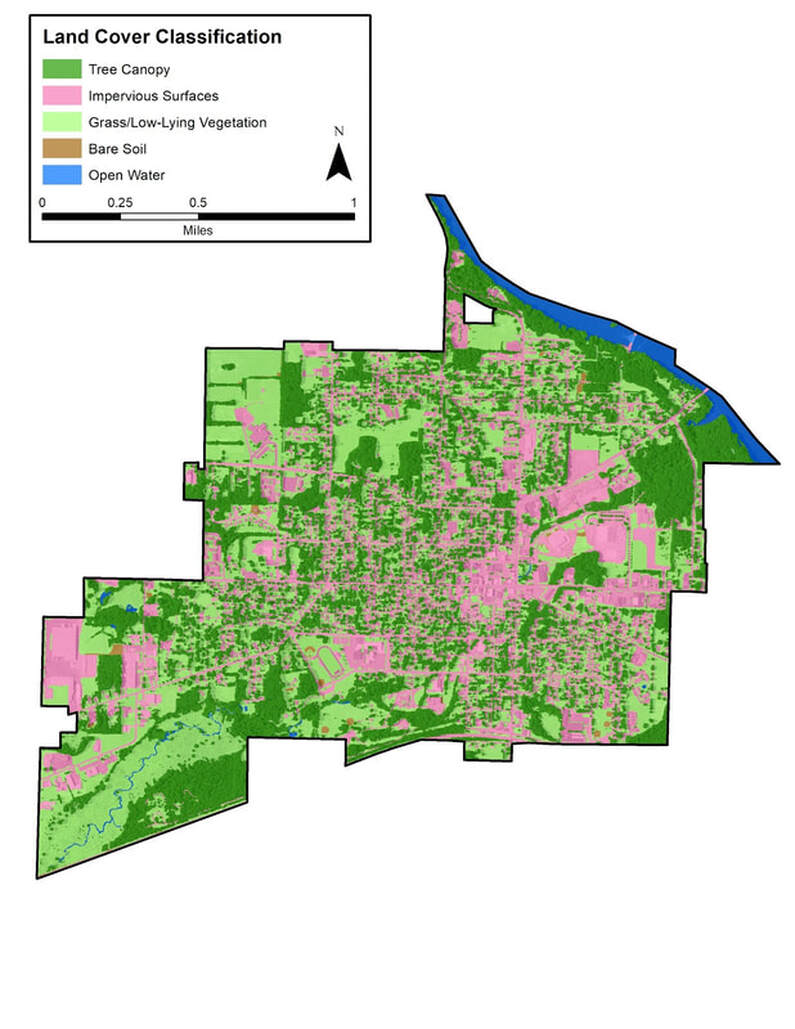
Figure 1B. Buchanan land cover classification.
To view this and other maps in an interactive format visit the Story Map
Tree Canopy Related to Land Use
The level of tree canopy cover present in any given locality often correlates with how the land is utilized. Figure 2B illustrates a land use map of Buchanan, and Table 2B presents the various categories of land use as they relate to the five classifications of land cover detailed in the previous section.
In most communities, commercial and institutional areas tend to have lower levels of tree canopy and higher levels of impervious surfaces than residential or agriculture/forested districts. This pattern holds true for the City of Buchanan; The percentage of canopy cover in commercial and institutional areas is 9% and 18%, respectively, while the percentage of impervious surfaces for the same areas is 53% and 54%, respectively. Agriculture/forested land contains the highest level of tree canopy cover at 54%, while residential areas are at 39% canopy coverage.
While opportunities should be pursued to increase canopy cover in commercial, institutional, and open space/recreational areas, suitable planting locations may be limited. High levels of impervious surface restrict available locations within commercial and institutional locations. Open space/recreational areas have an abundance of grass/low-lying vegetation (60%), which may seem ideal for planting, but likely represent maintained parks and playgrounds, sports fields, community gardens, or other areas intentionally cultivated or designed to have lower tree canopy levels. Residential areas present effective opportunities for new plantings, often with great results; Engaged residents are receptive to planting efforts that produce results they can see and enjoy on a daily basis.
Careful review of all areas, to identify suitable planting locations and increase tree canopy is critical because these land uses may have the most significant impact on the quantity and quality of the community’s stormwater run-off.
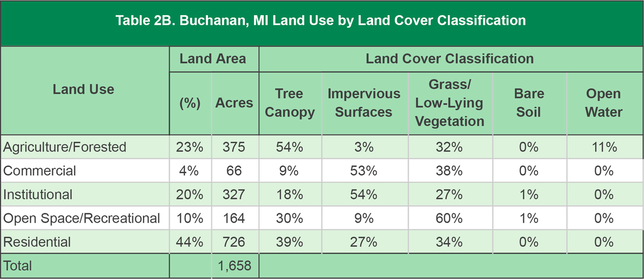
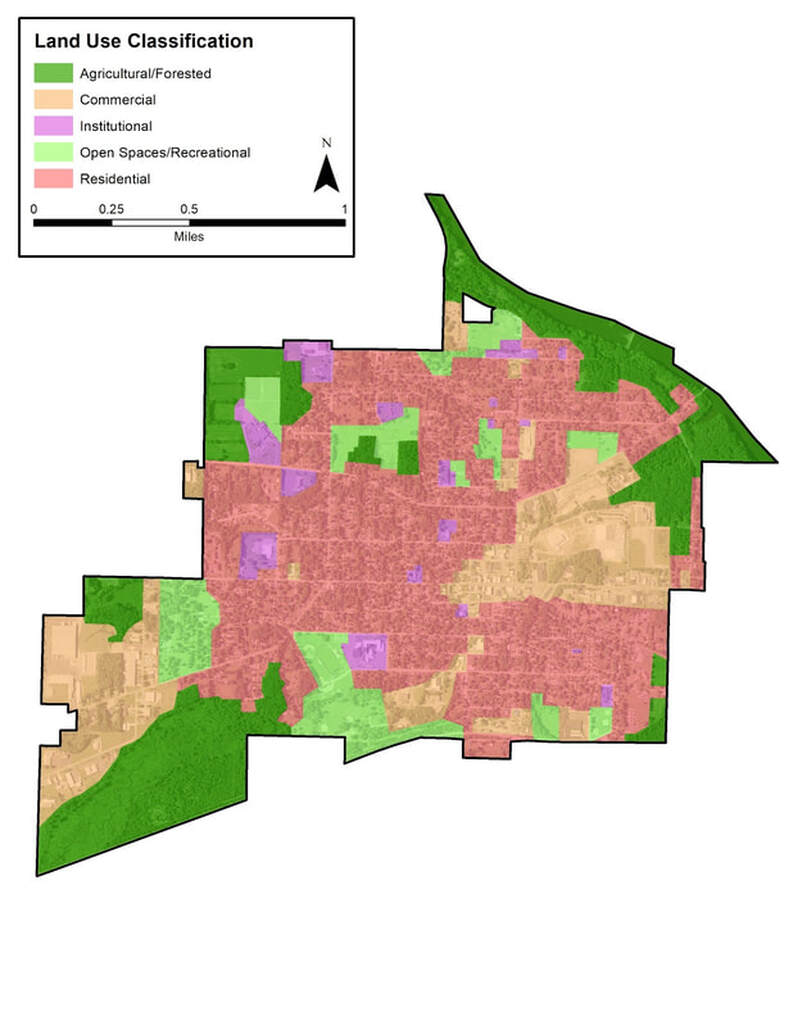
Figure 2B. Buchanan land use classification.
Priority Planting Areas
The priority planting analysis digs deeper into Buchanan’s land cover data in order to identify and prioritize potential areas for new tree plantings. Only grassy areas, open space, and bare soil were included in the analysis. Non-feasible planting areas, such as agricultural fields, recreational fields, major utility corridors, etc. were excluded from consideration. Once potential planting areas were identified, locations were assigned a priority ranking through an assessment of a variety of environmental features, including a given site’s proximity to hardscape and existing tree canopy, soil permeability, slope, soil erosion, floodplain proximity, and the urban heat island index.
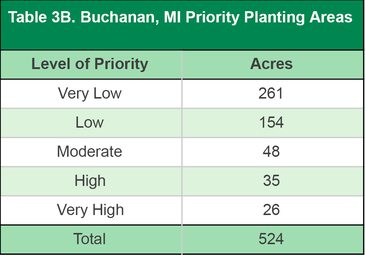
The map of priority planting levels (Figure 3B) can be used to identify potential locations where new plantings may deliver the most impact in terms of ecosystem and community benefits. For example, Buchanan can use this map as a guide when deciding where future trees should be planted to have the greatest effect on lessening stormwater runoff. Of the city’s 524 plantable acres, 109 acres (21%) are assigned a planting priority of Moderate or above (Table 3B). If only these areas are planted, Buchanan’s canopy coverage would increase from 597 acres to 706 acres, increasing total canopy coverage to 43%.
The map of priority planting levels (Figure 3B) can be used to identify potential locations where new plantings may deliver the most impact in terms of ecosystem and community benefits. For example, Buchanan can use this map as a guide when deciding where future trees should be planted to have the greatest effect on lessening stormwater runoff. Of the city’s 524 plantable acres, 109 acres (21%) are assigned a planting priority of Moderate or above (Table 3B). If only these areas are planted, Buchanan’s canopy coverage would increase from 597 acres to 706 acres, increasing total canopy coverage to 43%.
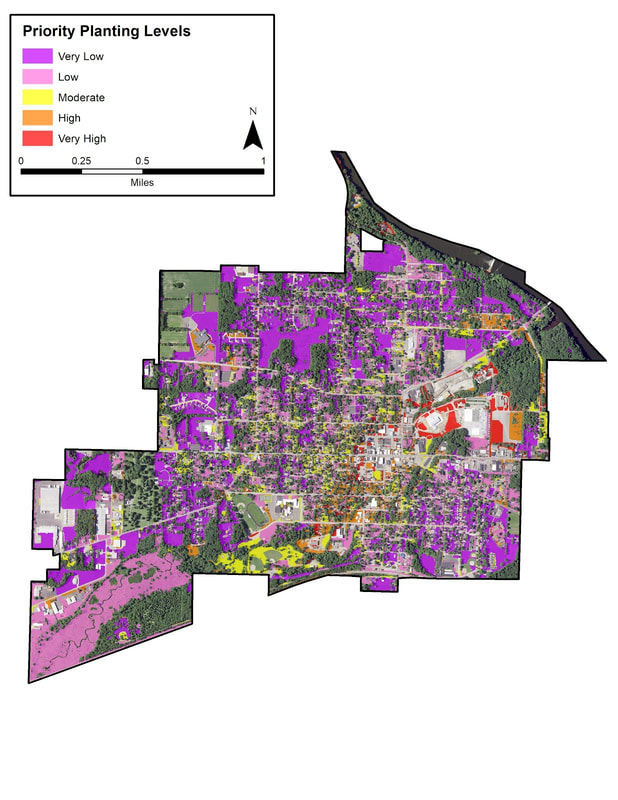
Figure 3B. Buchanan prioritized planting areas.
Canopy Percent by Census Block
Analysis of tree canopy percentage by census block can be used as a supplemental tool in determining which neighborhoods are in most need of new plantings (Figure 4B). For Buchanan, the canopy coverage by census block analysis correlates with the results of the priority planting area analysis; Many of the areas assigned a Moderate, High, or Very High planting priority are located in census blocks with less than 25% canopy coverage. Particularly noticeable is Buchanan’s city-center, which contains less than 15% canopy coverage per the census block analysis and also exhibits a high concentration of red areas (Very High priority) per the planting priority analysis.
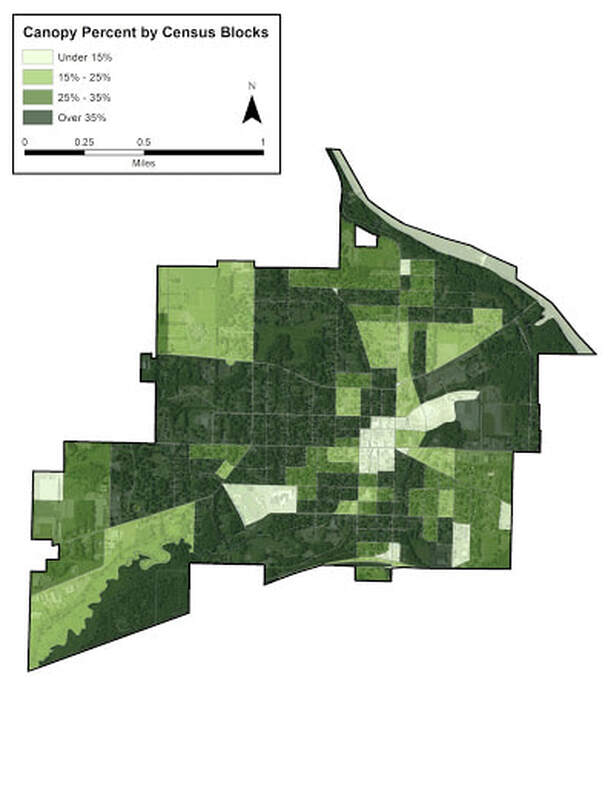
Figure 4B. Buchanan tree canopy by census block.
Canopy Percent by Right-of-Way (ROW)
Assessment of the canopy coverage percentage along city right-of-way (ROW) can help provide insight into a segment of the community forest that a municipality can most directly affect; its public streets. Canopy ROW analysis allows planners to identify specific streets within the community with minimal canopy coverage and thus target critical areas on which to focus new planting efforts. Oftentimes, the lowest percentage of ROW canopy is found along state routes and streets within commercial areas. This trend holds true in Buchanan, where the right-of-ways with the lowest percentage of canopy coverage are observed in the city-center and commercial area near the city’s western boundary (Figure 5B)
The analysis also reveals Red Bud Trail North and River Street as two key areas for future ROW plantings. Planting efforts in commercial areas will require buy-in from the area businesses who may have concerns of trees blocking view of their signage. These concerns can be alleviated by ensuring that the correct trees, both in terms of species and size, are chosen to suit the planting spaces along the ROW. Remember the mantra “right tree, right place.”
The analysis also reveals Red Bud Trail North and River Street as two key areas for future ROW plantings. Planting efforts in commercial areas will require buy-in from the area businesses who may have concerns of trees blocking view of their signage. These concerns can be alleviated by ensuring that the correct trees, both in terms of species and size, are chosen to suit the planting spaces along the ROW. Remember the mantra “right tree, right place.”
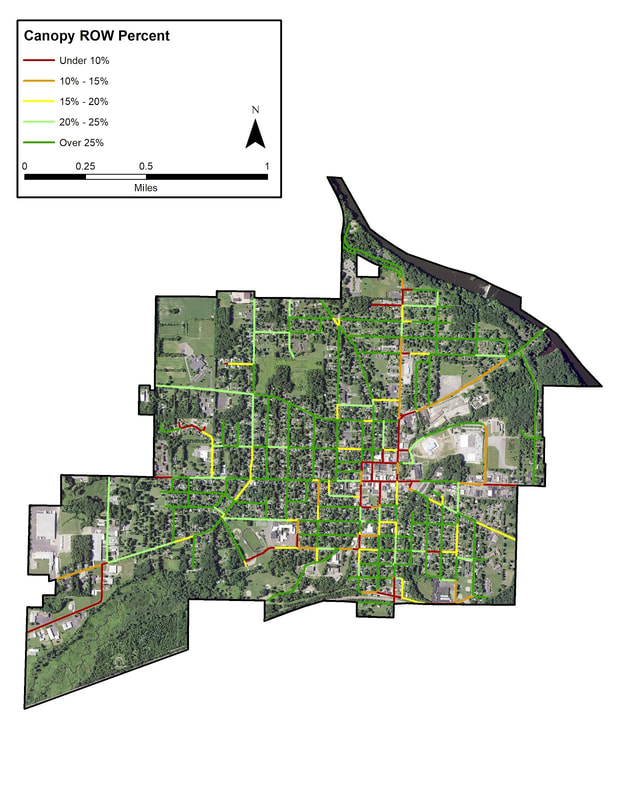
Figure 5B. Buchanan right-of-way canopy cover.
Ecosystem Benefit Analysis
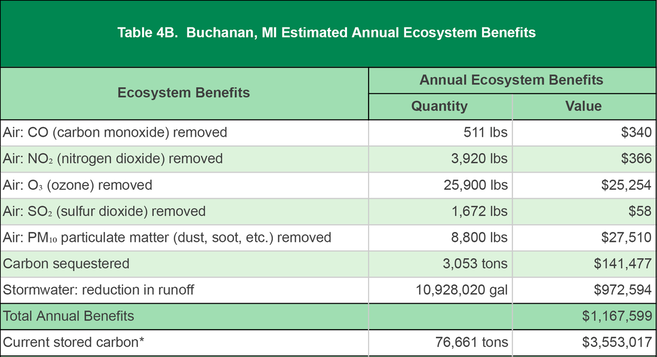
Community forests are important components of the ecosystem and provide quantifiable benefits. In total, Buchanan realizes an annual benefit of $1,167,599 from its trees (Table 4B). These annual benefits include $53,528 in reduction of air pollution, carbon sequestration equivalent to $141,477, and stormwater reduction valued at $972,594. Additionally, the city’s trees are estimated to have stored 76,661 tons of carbon over the course of their lifetime for an estimated total value of $3,553,017.
Custom Assessment: Tree Placement Analysis
The potential tree planting opportunities within Buchanan city limits were analyzed utilizing a tree placement model. This custom analysis models tree placement by randomly assigning trees of varying size-class within the previously identified planting priority areas. The model outputs report the number of large, medium and small mature-sized trees that could be planted within each planting priority rank category.
In Buchanan, the placement analysis model estimates a total of 2,899 trees that can be planted in areas with a planting priority rating of Moderate or above (Table 5B). Of these, 1,906 are small-maturing trees, 505 are medium-maturing, and 489 are large-maturing trees. Figure 6B shows a map of the City of Buchanan and planting locations for small, medium, and large trees within planting priority areas of Moderate, High, and Very High.
In general, large-maturing trees planted in Very High planting priority areas will provide the greatest returns on new planting investments; several such planting sites are identified in the commercial and institutional land use areas surrounding the city center by the intersection of Red Bud Trail and Front Street. Numerous High and Very High priority sites are also present in the residential land use areas just south of Front Street, nearby Buchanan High School. Careful study of this analysis will help planners select both tree locations and tree species that can optimize community benefits.
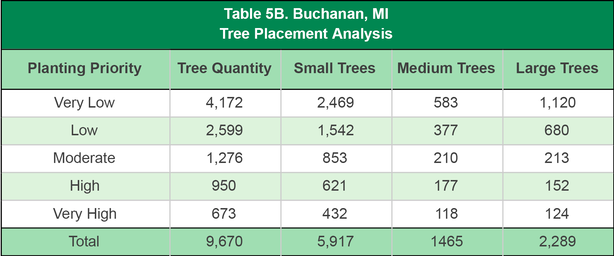
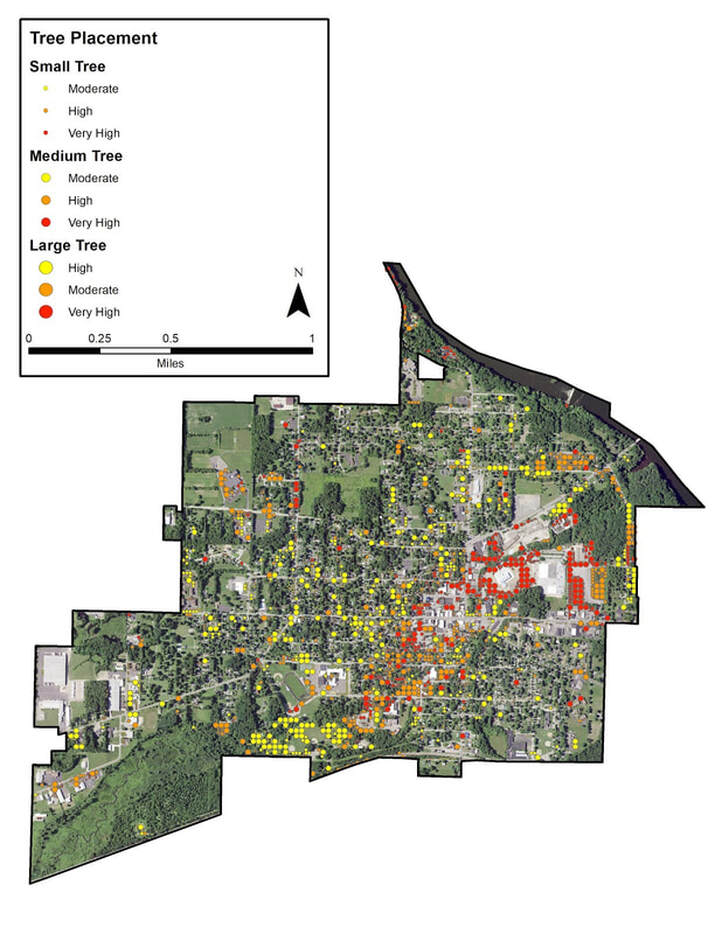
Figure 6B. Buchanan, MI tree placement analysis.
Custom Analysis: Community Tree Canopy Health Assessment
An index of tree health can be created through analysis of the spectral characteristics of the tree canopy layer utilizing the Normalized Difference Vegetation Index (NDVI). The NDVI is a simple graphical indicator that can be used in assessing whether or not the target being observed contains live green vegetation. The NDVI is useful in identifying locations of vegetation in poor or declining health.
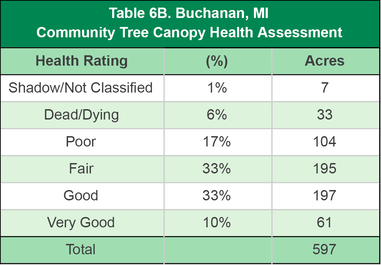
Buchanan’s 597 acres of tree canopy were analyzed using the NDVI in conjunction with remote sensing methods in order to create a visual tree health index for assessing the condition of the community tree canopy. Based on the analysis, approximately 76% of the city’s canopy acres are rated in fair or better health (Table 6B), while 23% were determined to be in poor or worse condition. Slightly more than 1% of the city’s canopy could not be classified due to shadows or other obstacles preventing accurate analysis.
These results can be useful in targeting maintenance, preservation, restoration, or removal efforts to improve deficient areas of community tree canopy. Figure 6B, a map of Buchanan’s tree health index, provides a visual indicator of some of these areas.
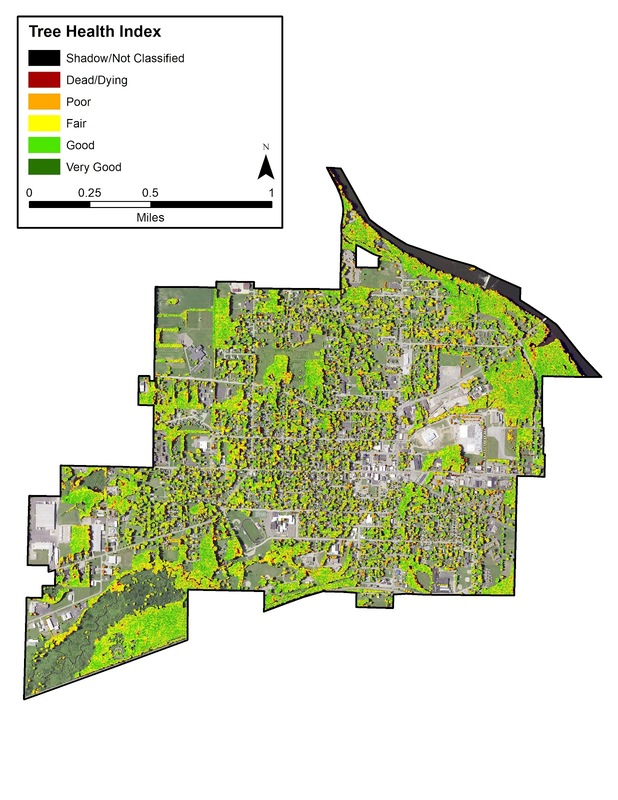
Figure 7B. Buchanan tree health index.
