Sturgis, Michigan
Sturgis, population 10,806[4], is nestled amongst the glacial lakes of St. Joseph County, Michigan, near the Indiana border. Known as the “Electric City” due to its municipal electric utility and hydroelectric dam, which has served the community since 1911, Sturgis has earned distinction for more than 26 years running as a Tree City USA from the National Arbor Day Foundation.
Land Cover Classification
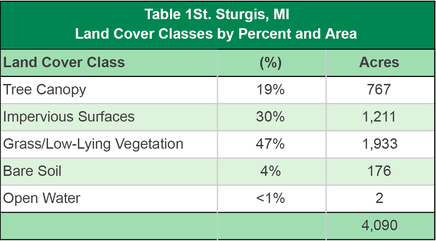
The tree canopy of Sturgis is estimated to cover 767 acres and account for 19% of the city’s total land cover (Table 1St). Over one-half of the city’s land cover (51%) consists of grass/low-lying vegetation and bare soil, while impervious surfaces such as buildings, roads, and other types of pavement cover 30% of Sturgis’ total land area.
Figure 1St presents a map of Sturgis with an overlay of the five classifications of land cover. Impervious surfaces are found in high concentrations on the western side of town and along Chicago Rd (U.S. Route 12). Canopy coverage is reasonably well spread out throughout the central part of Sturgis, and the highest concentration of canopy is found on the eastern edge of the city behind Thurston Woods Village.
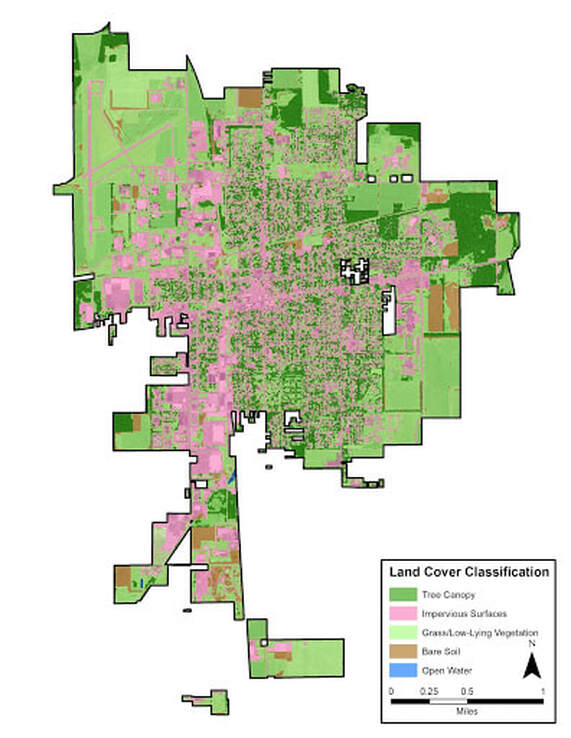
Figure 1St. Sturgis land cover classification.
To view this and other maps in an interactive format visit the Story Map
Tree Canopy Related to Land Use
The level of tree canopy coverage within a community often correlates with how the land is utilized. Figure 2St illustrates a land use map of Sturgis, and Table 2St presents the various categories of land use as they relate to the five classifications of land cover detailed in the previous section.
In most communities, commercial and institutional areas tend to have lower levels of tree canopy and higher levels of impervious surfaces than residential or agriculture/forested districts. This pattern holds true for the City of Sturgis; the percentage of canopy cover in commercial and institutional areas is 5% and 9%, respectively, while the percentage of impervious surfaces for the same areas is 51% and 54%, respectively. Residential areas, concentrated in the geographic middle of the city, have the highest level of tree canopy cover at 30%, and agricultural/forested land, primarily located around the perimeter of the city, includes 23% canopy coverage.
Opportunities to expand canopy coverage should be pursued in all land use areas, though suitable planting locations may be limited, particularly within commercial, institutional, and open space/recreational areas. High levels of impervious surface restrict available locations within commercial and institutional locations. Open space/recreational areas, which are predominantly grass/low-lying vegetation (68%), may seem ideal for planting, but likely represent maintained parks and playgrounds, sports fields, community gardens, or other areas intentionally cultivated or designed to have lower tree canopy levels. Residential areas generally present effective opportunities for new plantings; engaged residents are receptive to planting efforts that produce results they can see and enjoy on a daily basis.
Careful review of all areas is key to identify suitable planting locations and increase overall tree canopy.
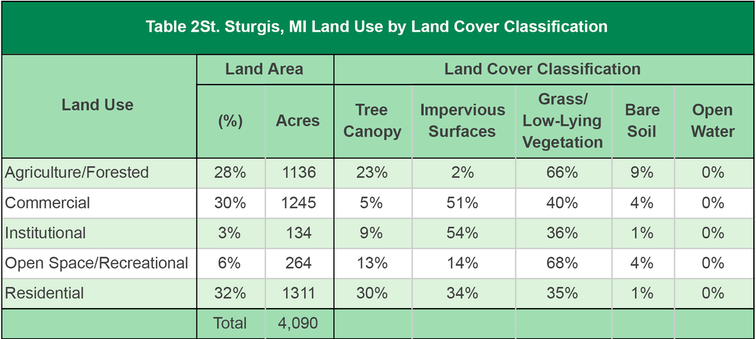
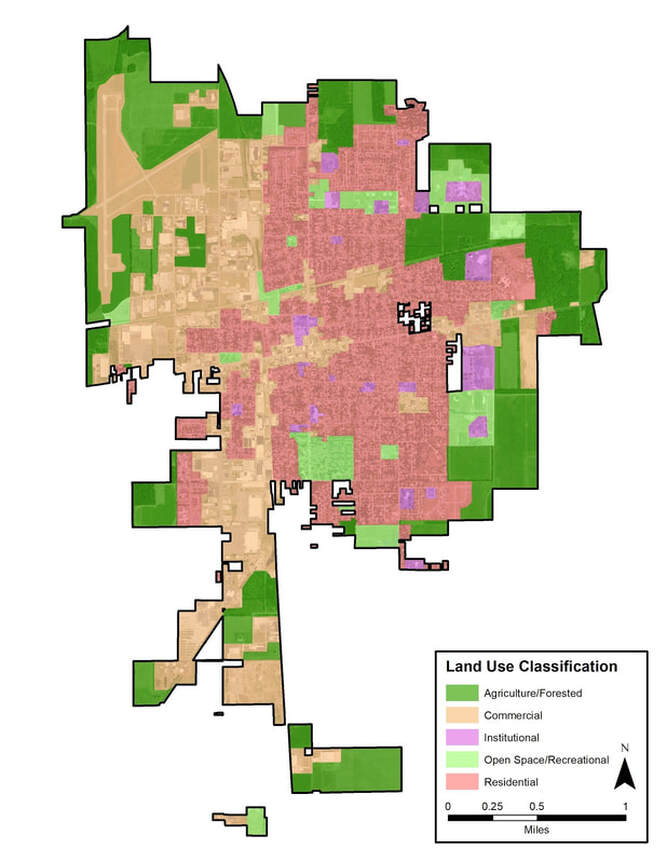
Figure 2St. Sturgis land use classification.
Priority Planting Areas
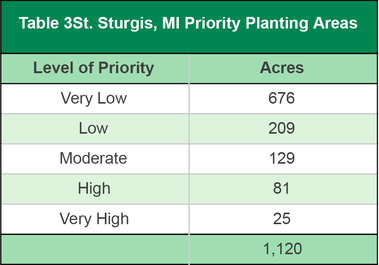
The priority planting analysis digs deeper into Sturgis’s land cover data in order to identify and prioritize potential areas for new tree plantings. Only grassy areas, open space, and bare soil were included in the analysis. Non-feasible planting areas, such as agricultural fields, recreational fields, major utility corridors, etc. were excluded from consideration. Once potential planting areas were identified, locations were assigned a priority ranking through an assessment of a variety of environmental features, including a given site’s proximity to hardscape and existing tree canopy, soil permeability, slope, soil erosion, floodplain proximity, and the urban heat island index.
Of the city’s 1,120 plantable acres, 235 acres (21%) are assigned a planting priority of Moderate or above. If Sturgis focused planting efforts on maximizing the potential of these areas, then the city’s canopy would grow from 767 acres to 1,002 acres, increasing total canopy coverage to 24.5%.
The map of priority planting levels (Figure 3St) can be used to identify potential locations where new plantings may deliver the most impact in terms of ecosystem and community benefits. Sturgis can use this map as a guide when deciding where future trees should be planted to have the greatest effect on lessening stormwater runoff. The map reveals a concentration of Very High, High, and Moderate planting priority areas within the residential and commercial land use areas in the middle of the town. These areas merit further investigation for consideration for new tree planting initiatives.
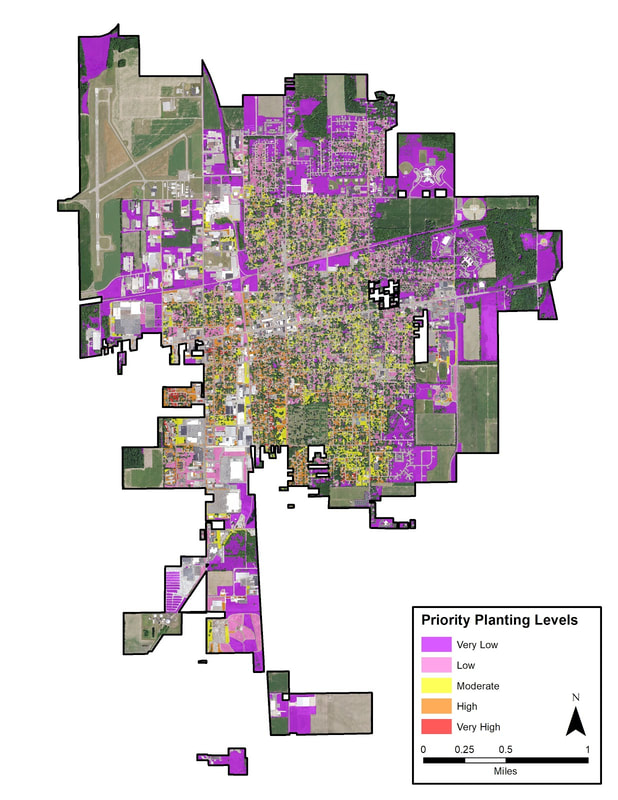
Figure 3St. Sturgis prioritized planting areas.
Canopy Percent by Census Block
Analysis of tree canopy percentage by census block can be used as a supplemental tool in determining which neighborhoods are in most need of new plantings (Figure 4St). The previous analysis indicated that there were priority planting areas in the southwestern portion of Sturgis. The census block analysis reveals several blocks within the same area that contain 10%-20% canopy coverage as well as blocks with less than 10% canopy coverage. Planting efforts focused on priority planting areas within canopy deficient census blocks will help deliver the highest value for the investment in new tree plantings.
The census block analysis also identifies the northwestern area of town, Kirsch Municipal Airport, as an area with less than 10% canopy coverage. While suitable planting locations may be limited around the airport, effort should be made to install new plantings where feasible. Even small-stature trees can contribute to tree canopy and stormwater management.
The census block analysis also identifies the northwestern area of town, Kirsch Municipal Airport, as an area with less than 10% canopy coverage. While suitable planting locations may be limited around the airport, effort should be made to install new plantings where feasible. Even small-stature trees can contribute to tree canopy and stormwater management.
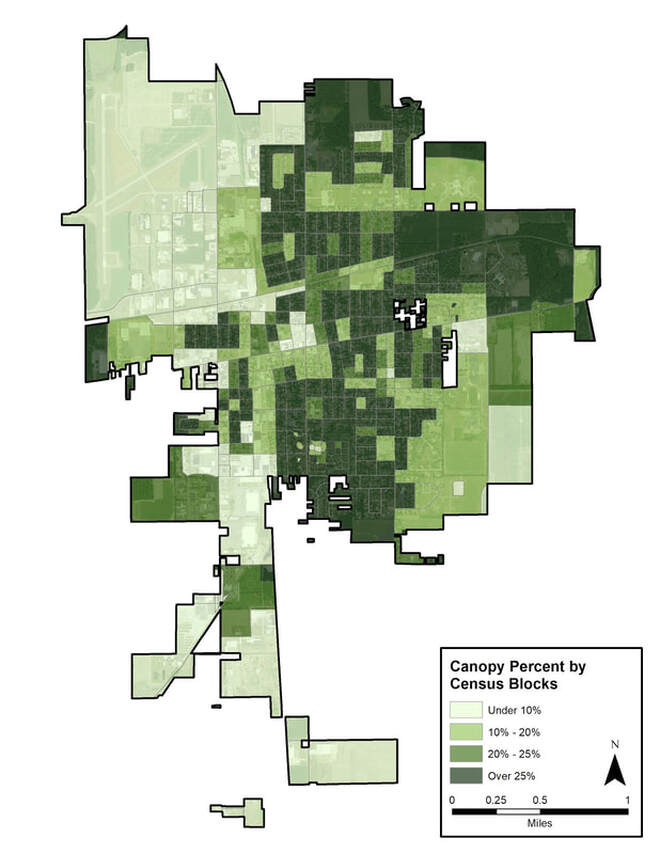
Figure 4St. Sturgis tree canopy by census block.
canopy Percent by Right-Of-Way (ROW)
Assessment of the canopy coverage percentage along city right-of-way (ROW) can help provide insight into a segment of the community forest that a municipality can most directly affect: its public streets. Canopy ROW analysis allows planners to identify specific streets within the community with minimal canopy coverage and thus target critical areas on which to focus new planting efforts. Oftentimes, the lowest percentage of ROW canopy is found along state routes and streets within commercial areas. In Sturgis, this trend appears to hold true (Figure 5St).
The analysis reveals that the main thoroughfares, Chicago Road (U.S. Route 12), South Centerville Street, and North Ottawa Street contain less than 10% canopy coverage. These roads are good targets for city street ROW tree planting efforts. It is important that planting initiatives work to earn buy-in from the area businesses who may have concerns, such as the potential for tree canopy to reduce visibility of their business signage or for tree roots to damage sidewalks and other hardscape. Many concerns can be alleviated by ensuring that the correct trees, both in terms of species and size, are chosen to suit the planting spaces along the ROW. Remember the mantra “right tree, right place.”
The analysis reveals that the main thoroughfares, Chicago Road (U.S. Route 12), South Centerville Street, and North Ottawa Street contain less than 10% canopy coverage. These roads are good targets for city street ROW tree planting efforts. It is important that planting initiatives work to earn buy-in from the area businesses who may have concerns, such as the potential for tree canopy to reduce visibility of their business signage or for tree roots to damage sidewalks and other hardscape. Many concerns can be alleviated by ensuring that the correct trees, both in terms of species and size, are chosen to suit the planting spaces along the ROW. Remember the mantra “right tree, right place.”
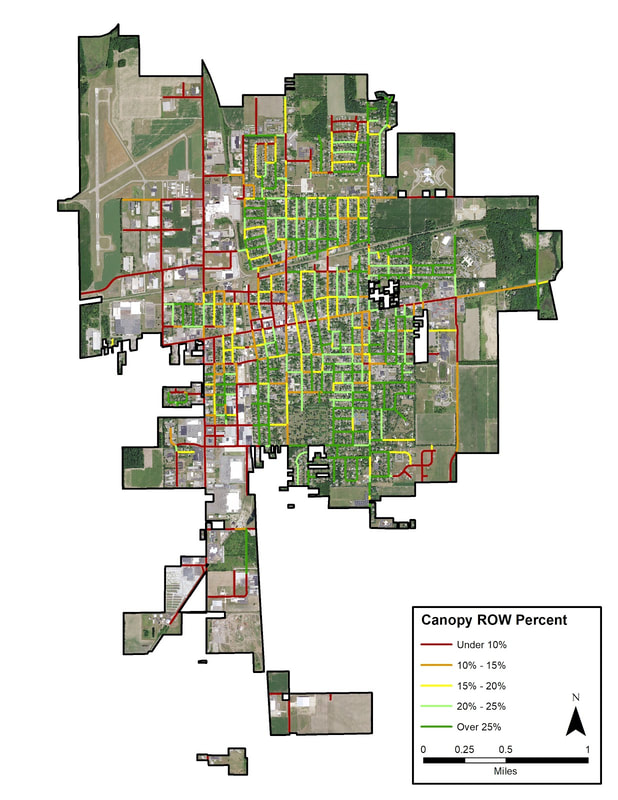
Figure 5St. Sturgis right-of-way canopy cover.
Ecosystem Benefits Analysis
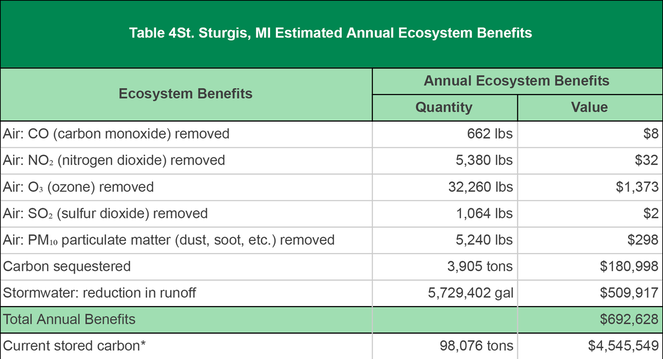
Community forests are important components of the ecosystem and provide quantifiable benefits. In total, Sturgis realizes an annual benefit of $692,628 from its trees (Table 4St). These annual benefits include $1,714 in reduction of air pollution, carbon sequestration equivalent to $180,998, and stormwater reduction valued at $509,917. Additionally, the city’s trees are estimated to have stored 98,076 tons of carbon over the course of their lifetime for an estimated total value of $4,545,549.
Custom Assessment: Soil Characteristic Analysis
The soil characteristics map (Figure 6St), display soil type, percent of clay in the soil, pH, and drainage. This map layer is useful in determining where trees can assist with decreasing flooding throughout the city. This map should be used in conjunction with the Recommended Tree Species List for St. Joseph River Watershed to determine the appropriate trees to plant under the soil conditions available. This species list has been customized to include species that will be hardy in USDA Hardiness Zone 5b and 6a and trees that are available from the local nurseries. The list includes the root space needed, height at maturity, the soil characteristics, pH tolerance, salt tolerance, among other factors to assist in choosing the “right tree for the right place.” The following list can be used as a general guide of good species to use for different purposes and soil issues:
Trees adapted to floodplains and swamps can be used for poorly drained, heavy clay, or severely compacted soils. Examples include:
Trees that occur in sandy soils are suitable for excessively drained, sandy, or droughty soils, such as:
Trees with large amounts of leaf surface area are great for stormwater capture or management, such as:
The planting priority level map layer should be used in conjunction with the soil characteristics map layer and finally with the recommended tree planting list to prioritize planting efforts and to determine the best locations for new plantings. Establishing ideal planting locations is important to maximize the benefits trees can provide to the community to reduce air pollution and flooding.
Trees adapted to floodplains and swamps can be used for poorly drained, heavy clay, or severely compacted soils. Examples include:
- River birch
- Freeman maple
- Swamp white oak
- Eastern hackberry
- Bald cypress (in wetter areas, at northern extent of range)
- Dawn redwood (at northern extent of range)
- Blackgum (at northern extent of range)
- Honeylocust (compacted, not necessarily wet)
- Kentucky coffee tree (compacted, not necessarily wet)
- Burr oak
Trees that occur in sandy soils are suitable for excessively drained, sandy, or droughty soils, such as:
- Red pine
- Jack pine
- White oak
- Smooth sumac
Trees with large amounts of leaf surface area are great for stormwater capture or management, such as:
- Various oaks
- Black willow
- Cottonwood
- Freeman maple
- Red maple
- Hybrid elm
- Sycamore
- London planetree
The planting priority level map layer should be used in conjunction with the soil characteristics map layer and finally with the recommended tree planting list to prioritize planting efforts and to determine the best locations for new plantings. Establishing ideal planting locations is important to maximize the benefits trees can provide to the community to reduce air pollution and flooding.
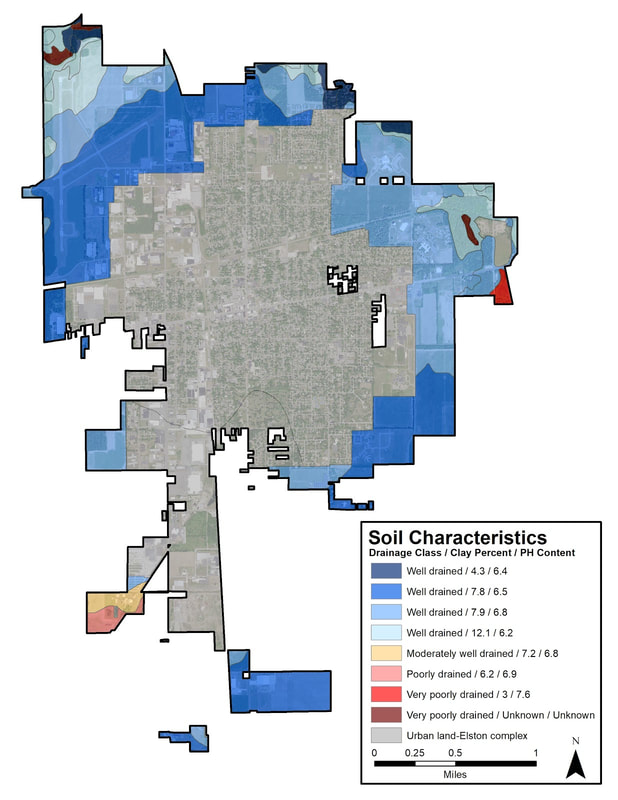
Figure 6St. Sturgis soil characteristic analysis.
